Air quality - What are the results locally?
The Zephyr monitors produce real time data that is used to produce graphs for different time periods.
Live air quality data from our Zephyr monitors can be found South Ribble Public Air Quality Portal.
 |
|---|
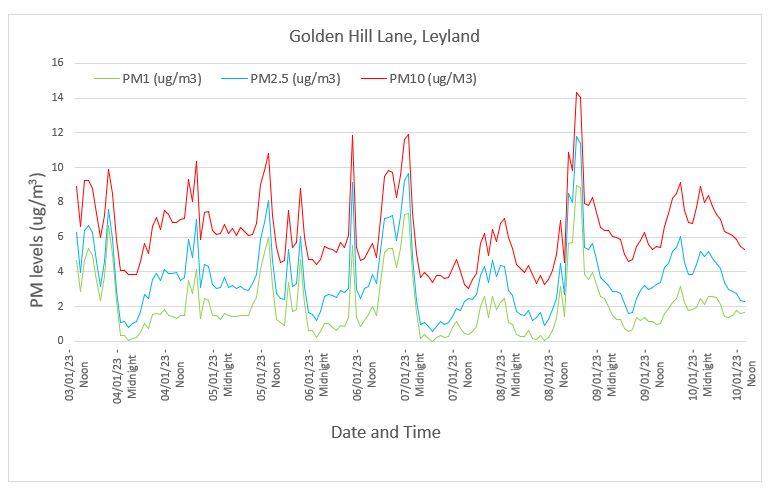 |
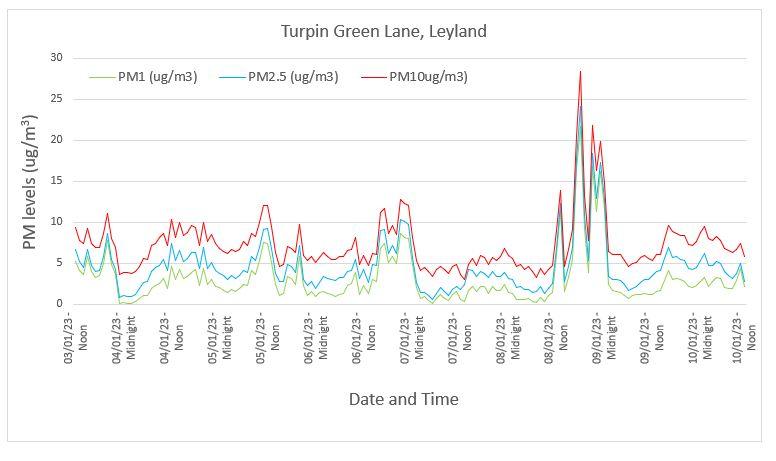
The above graphs show particulate matter readings over a 7-day period from 3rd January 2023. The readings for these graphs are taken hourly. The different colours show the different PM sizes, from the smallest PM1 (green), medium PM2.5 (blue) to the largest PM10 (red). The peaks on the graph tally with normal rush hour times during the day. The 7th and 8th January are the weekend, with lower traffic movement and lowest amounts of PM shown on the graph. There is as yet unexplained peak on the afternoon and night of the 8th January for Turpin Green Lane.
The left axis shows the level of Particulate Matter (PM) in the air. It never reaches the maximum 24-hour mean level of 50 μg/m3 for PM 10.
 |
|---|
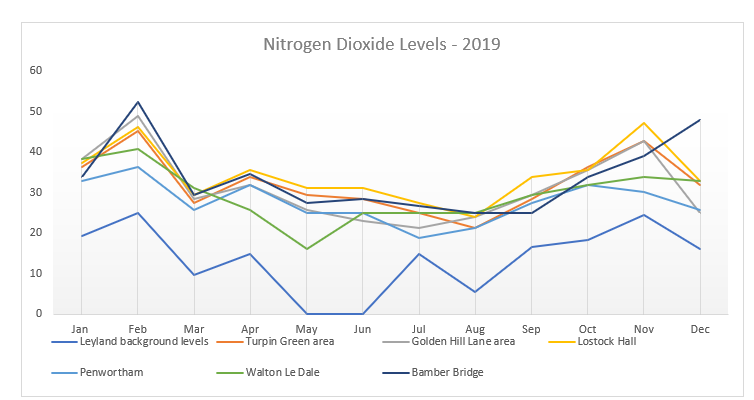
Nitrogen dioxide tubes are collected monthly and sent away to a laboratory to be processed. The graph shows average figures for 2019, the last full set of data that is available, pre Covid-19. These are the most realistic figures, as traffic levels dropped dramatically during lockdown and the laboratories shut for a period of time. You can see that there is a peak above the maximum 40 μg/m3 level in February and again in November. Background pollution levels were also higher during these months.
Each year the council completes a report on the air quality across the borough and the actions being taken to improve it.
- 2019 Air Quality Report (PDF) [2MB]
- 2021 Air Quality Report (PDF) [1MB]
- 2022 Air Quality Report (PDF) [1MB]
- 2023 Air Quality Report (PDF) [1MB]
- 2024 Air Quality Report (PDF) [2MB]
- 2025 Air Quality Report (PDF) [1MB]
- Developers Guide (Planning Advisory Note - Low Emissions and Air Quality 2020) (PDF) [2MB]
If you require these reports in a more accessible form, please get in touch with our Environmental Health Team on 01772 625625.